OPENING QUESTIONS: We're to actually explore the world of "big data" today.
Towards that end, please take a gander on the AP Learning Targets for data by opening the AP Course Guide (*gulp*) and finding your way to section 2.4 "Using Programs With Data"
OBJECTIVES:
I will work with a large data set from the Ocean Observatories Initiative - Cabled Array to graph tsunami characteristics from original data during today's class.
WORDS FOR TODAY:
- Big Data - a broad term for datasets so large or complex that traditional data processing applications are inadequate.
- Moore's Law - a predication made by Gordon Moore in 1965 that computing power will double every 1.5-2 years, it has remained more or less true ever since.
- Field - A holder of unique data of a unique data type (For example an AGE field contains integer data that stores a person's age. A field named FNAME would store character data that stores a person's first name
- Record - A "Row" of data related to a specific topic. For example FNAME, LNAME, ADDRESS, CITY, STATE, ZIP would contain data relating to a specific person.
- Table - A "Table" of data contains a bunch of rows of data. For example a spreadsheet is a table of data.
- Data Types:int | long | boolean | date | text
- botNets: Nefarious users sometimes infect dozens, hundreds or even thousands of computers with malware that opens a certain port and..... listens for directions. The majority of the time that malware doesn't 'hear' anything. But very occasionally it receives instructions from the Nefarious actor instructing it (the infected computer) to execute some sort of 'attack'
- Rouge Access Point: These used to be fairly common but with widespread encryption and strong passwords they are much less so nowawadays. Nonetheless, the AP wants you to be aware of those: Imagine you are sitting in your favorite coffee shop and the network is down. You can your wifi network options and you find one that is open, available and says "FreeNet". You click on that wifi and your laptop is connected to that network. The bad news is whatever is flying across that wifi router is intercepted. uh oh!
- Filter: A method for selecting a subset of data from a larger data set
Background:
I developed a fairly intense activity for selecting real world data sets from the Ocean Observatories Initiative data portal -- a project I spent many hours on under a grant from the folks at West Sound Stem. We were going for a much larger National Science Foundation grant-- unfortunately we were not successful in that.
The goal was to show that it is possible to measure small amplitude tsunami (just a few centimeters) generated by large earthquakes and other seismic events like the Tonga volcanic explosion from a few years back using state-of-the-art instrumentation currently found underwater off the Pacific Northwest Coast.
Please watch the following tutorial video to get a 'flavor' of the steps required to actually select the data from state-of-the-art instrument ion on the ocean floor (and throughout the 'water column') off the Pacific Northwest Coast.
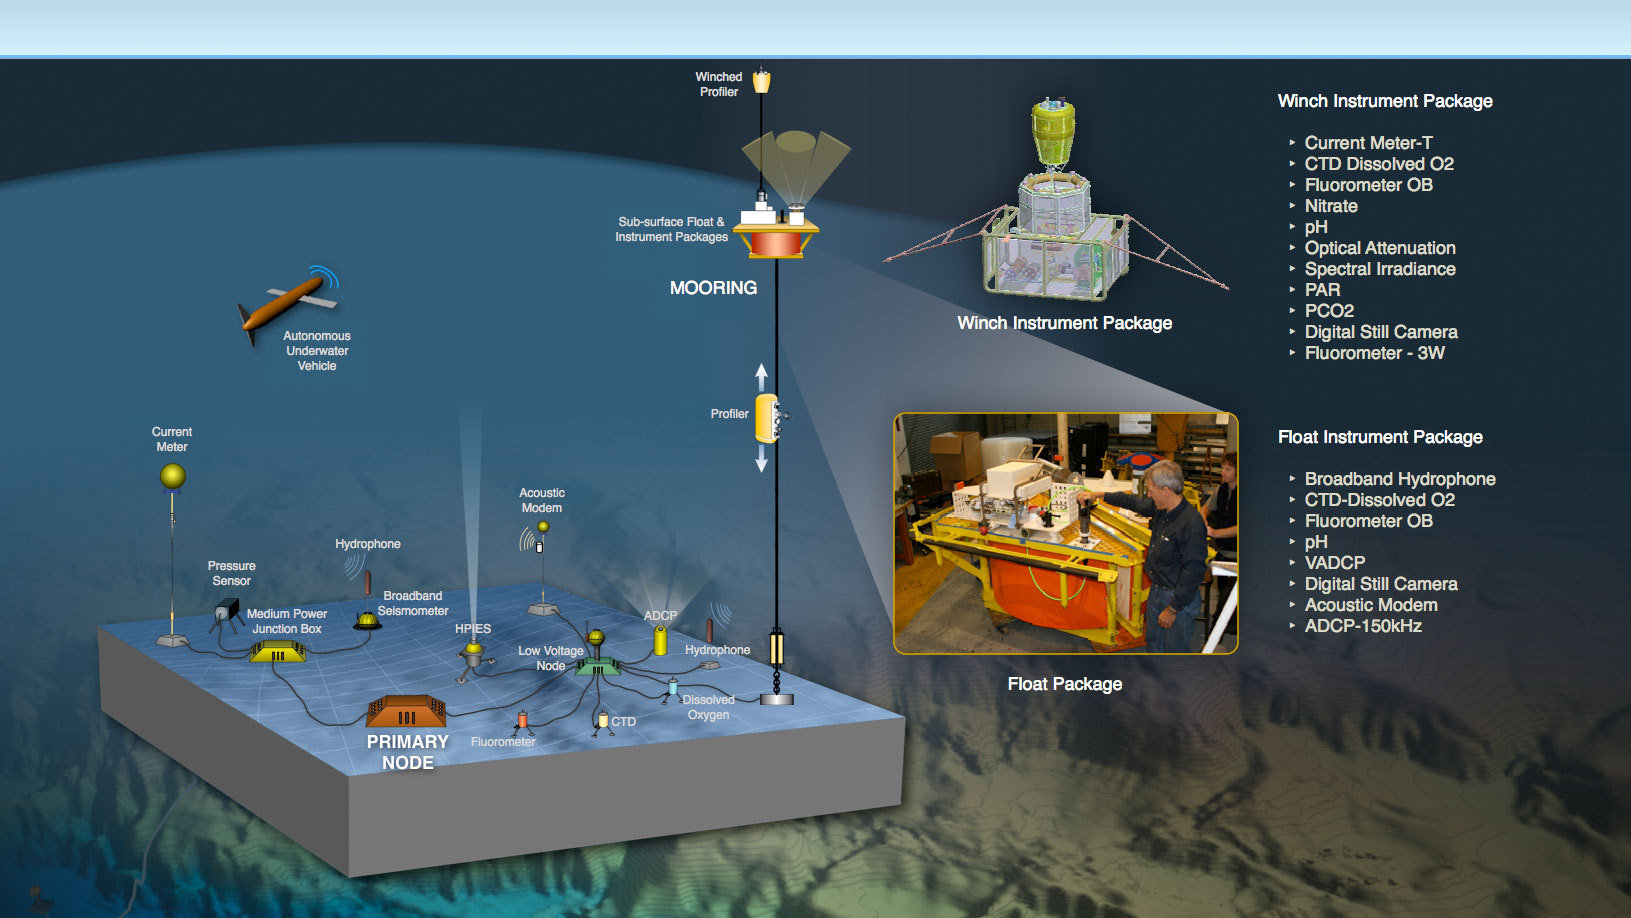
The graphic below shows the instrumentation layout of just one of the dozen or so sites around the PNW coast:
Keep in mind that one of our learning targets is selecting and obtaining data. Since the portal is no more, we can't actually go through the 'getting data' process but you can see how that was done in the video.
By the By: This project is illustrative of the joys and pitfalls on working on a big project funded with grants. I spent a few hundred hours on the project over a couple of years developing this curriculum and I'm very proud of the results.
The bad news is that the OOI - Data Portal ran out of funding and my project is dead (The OOI is VERY much alive btw). It's possible they may get funding in the future but as of now it remains a favorite bit of work I've done, but still a bit bittersweet (as it were!)
Video: HERE
WORK O' THE DAY:
I'll assist in offering a tour of the NOAA site HERE
Here's how we collected data last year:
We will be using the Bottom Pressure Sensor (PREST) data from the Ocean Observatories Initiative - Cabled Array. That instrument is only found at (I think?) 3 locations. I will assist!
That instrument measures the height of the water column above the sensor very precisely (up to 1 mm in 6000 meters of water!)
That sensor also reports data out at 1 data point per second. That means 3600 pts per hour, 36,000 data points in 10 hours, 72,000 data points in 20 hours, ~ 90,000 in a day and 360,000 per week. So we have to be mindful of how their system performs.
- We will be looking for subtle but distinct changes in the wave heights that appear as 'flutters' or clusters of waves that stand out from the surrounding data
Here's Sample Data we'll use this year